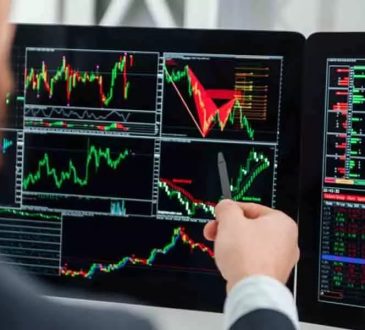


Candlestick charts are the most widely used charting method in crypto trading. They were originally developed in Japan in the 18th century for rice trading and are now the standard for tracking price movements across global financial markets. This guide explains how to read candlestick charts as a beginner in the context of crypto trading in India.
What is a Candlestick Chart?
A candlestick chart shows the price movement of an asset over a specific time period. Each “candle” represents price activity during that period, whether 1 minute, 1 hour, 1 day, or any other timeframe.
Each candlestick has four components:
Open: The price at which the period began. Close: The price at which the period ended. High: The highest price reached during the period. Low: The lowest price reached during the period.
The rectangular body shows the range between open and close. The thin lines above and below (called wicks or shadows) show the high and low.
Bullish vs Bearish Candles
Green (Bullish) Candle: The close price is higher than the open. Price went up during this period.
Red (Bearish) Candle: The close price is lower than the open. Price went down during this period.
Key Candlestick Patterns to Know
Doji
A small body with long wicks on both sides. Signals indecision in the market. Neither buyers nor sellers dominated this period.
Hammer
A small body at the top with a long lower wick. Appears after a downtrend. Suggests buyers pushed the price back up after a significant drop. Often interpreted as a potential reversal signal.
Shooting Star
A small body at the bottom with a long upper wick. Appears after an uptrend. Suggests sellers pushed the price back down after a significant rise. Often interpreted as a potential reversal signal.
Engulfing Pattern
- Bullish Engulfing: A large green candle completely covers the previous smaller red candle. May signal an upward reversal.
- Bearish Engulfing: A large red candle completely covers the previous smaller green candle. May signal a downward reversal.
Marubozu
A candle with no wicks. Full green marubozu means buyers dominated entirely. Full red marubozu means sellers dominated entirely.
How to Use Candlestick Charts on ZebPay
ZebPay’s Pro chart view provides full candlestick chart functionality with multiple timeframes:
- Open the ZebPay app
- Select a coin (e.g., BTC/INR)
- Tap on the chart to open the detailed view
- Switch to the Pro or Advanced chart view
- Select your timeframe (1 minute, 5 minutes, 1 hour, 1 day)
- Zoom in or out using pinch gestures
Important Limitations of Candlestick Charts
Candlestick patterns are tools for interpreting price history, not predictions of the future. Here is what you need to understand:
No pattern is 100% reliable. Every pattern has false signals. A hammer does not guarantee a reversal.
Context matters. A pattern on a 5-minute chart has different significance than the same pattern on a weekly chart.
Volume should be considered. A bullish pattern with high volume is more meaningful than the same pattern with low volume.
Candlestick charts show what happened, not why. External events (news, regulations, market conditions) drive price, and candlestick patterns simply reflect those outcomes.
Using candlestick analysis alone without other factors (fundamentals, market conditions, risk management) is insufficient for making trading decisions.
Always conduct your own research before investing. Crypto markets are unpredictable and past trends do not guarantee future returns.
Read more: Crypto Trading Strategies
Frequently Asked Questions About Crypto Candlestick Charts
Do I need to know candlestick charts to buy crypto?
No. Candlestick charts are used for active trading decisions. If you are a long-term investor using a SIP, you do not need to analyse charts daily.
What timeframe should a beginner use?
Daily (1D) charts are less noisy and easier to interpret than minute-by-minute charts. Start with daily charts before moving to shorter timeframes.
Are candlestick patterns accurate for crypto?
Patterns are probabilistic guides, not certainties. Crypto markets are highly volatile and subject to sudden shifts from news events. Use patterns as one input among many, not as standalone signals.
What is the best candlestick pattern for beginners?
The hammer and bullish engulfing are commonly studied by beginners because they are relatively easy to identify. But always confirm with additional analysis before acting.
Does ZebPay have advanced charting tools?
ZebPay’s Pro chart view provides candlestick charts with multiple timeframes. Check the app for the latest chart features available.
Can I use candlestick charts for crypto SIP decisions?
SIP investing is based on regular fixed amounts at set intervals, not chart-based timing. Using chart analysis to frequently start and stop a SIP defeats its purpose.
Final Thoughts
Candlestick charts are a foundational skill for active crypto traders. Understanding what each candle represents, how to read patterns, and what they suggest about market sentiment helps you make more informed trading decisions.
For beginners, start with daily charts and practice identifying basic patterns before moving to shorter timeframes or more complex analysis.
Get started today and join 6 million+ registered users exploring crypto investing on ZebPay!
Disclaimer: Crypto products and NFTs are unregulated and can be highly risky. There may be no regulatory recourse for any loss from such transactions. Each investor must do his/her own research or seek independent advice if necessary before initiating any transactions in crypto products and NFTs. The information in this article is for educational purposes only and does not constitute financial or investment advice.